
Inside Google’s First Year of AI Mode: What 1 Billion Users Reveal About How Americans Search Now

Google’s first-year report on AI Mode is heavier on data than most product announcements. Read past the press-release tone and there is a real behavioral study underneath, one that has clear implications for how businesses get found in an answer-first search experience.
Key takeaways
- AI Mode passed 1 billion monthly active users in its first year, with query volume doubling every quarter since the U.S. launch in May 2025.
- The average AI Mode query is three times the length of a traditional Google search, and follow-up turns within a single session are growing more than 40% per month.
- More than one in six AI Mode queries are now non-text. Image-input searches have grown more than 40% month over month since launch, and image creation queries have more than tripled since the start of 2026.
- Planning queries are the fastest-growing category at 80% above the AI Mode baseline, followed by comparison queries (“which one”) at 40% above.
- Outside research from Pew, Wikipedia analysts, and Adobe shows traffic patterns are being redistributed rather than erased: casual informational clicks are absorbed into AI answers, while commercial clicks arrive with measurably stronger intent.
- Google’s own documentation states there is no special schema, file, or markup that earns inclusion in AI Mode. The work is making content something an AI system can actually understand and confidently recommend.
In May 2026, on the anniversary of AI Mode’s U.S. launch, Google published its first major analysis of how people are actually using the product. The headline number was the obvious one. AI Mode has passed more than 1 billion monthly active users globally, with query volume more than doubling every quarter since launch.
The growth speed is unusual even for Google. AI Mode rolled out broadly in the U.S. in May 2025 after a brief Search Labs pilot in March, and reportedly reached 75 million daily active users by November 2025 before scaling to its current size, according to coverage of Google I/O 2026. For context, that scale took roughly two decades to build with classic search.
But the more useful question is not how many people are using AI Mode. It is what they are doing with it, and what that says about how search is changing. Google’s AI Mode U.S. Insights report goes into surprisingly granular detail on query shapes, behavior patterns, and topic categories. Most of the early commentary has missed the more interesting parts, so the rest of this post walks through what the data actually says, what outside research adds to the picture, and what it means for any business that wants to stay visible inside an AI-mediated search experience.
A search behavior that no longer looks like search
The single most consequential finding in the report is about query shape. The average AI Mode query is three times the length of a traditional Google search query. For most of Google’s history, classic queries averaged just three or four words. People typed in fragments, the engine matched keywords, and the rest was up to the user. AI Mode does not work that way.
The shape of the question itself has changed. Google reports the most common first words in AI Mode queries are “What,” “How,” “I,” “Is,” and “Can,” and the most common verbs are “Find,” “Information,” “Identify,” “Explain,” and “Summarize.” Compare that to the old keyword pattern of “best running shoes 2024” or “weather denver,” and the change reads more like a conversation than a query.
That change extends across sessions. Follow-up queries in AI Mode are growing more than 40% per month on average in the U.S.. A single AI Mode session is no longer one search. It is a thread. Users arrive with a goal, refine as they learn more, and exit with a worked-out answer rather than a list of links.

Google has been candid about the technical reason this works. AI Mode uses what Google calls a query fan-out technique, where the system decomposes one complex prompt into many sub-queries, runs them in parallel against the index, and stitches the results into a single grounded response. A longer prompt is not noise. It is more signal to work with.
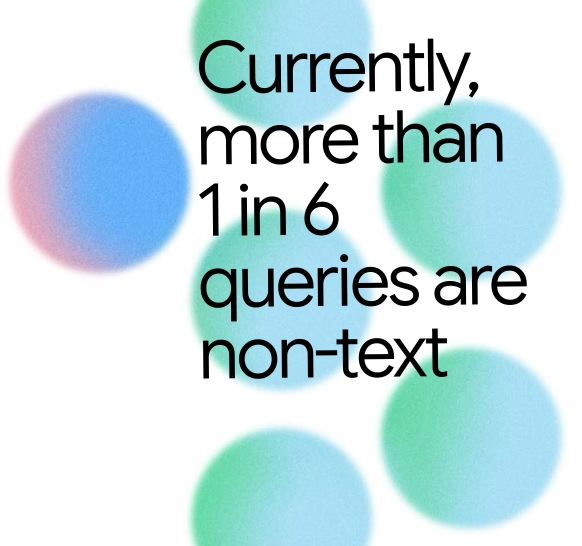
The same logic applies to non-text input. Google reports that more than one in six AI Mode queries are multimodal, with image-input searches growing more than 40% month over month since launch, and image creation queries having more than tripled since the start of 2026. People are photographing products, problems, places, and rooms, then asking questions about what the camera saw.
The five things people now ask AI Mode to do
Google’s report organizes user behavior into five patterns: Explore, Decide, Learn, Create, and Do. The framing is more useful than a flat topic list because each pattern points to a different business opportunity, a different content gap, and a different competitive dynamic. The five categories are worth walking through one at a time.
Explore: open-ended discovery
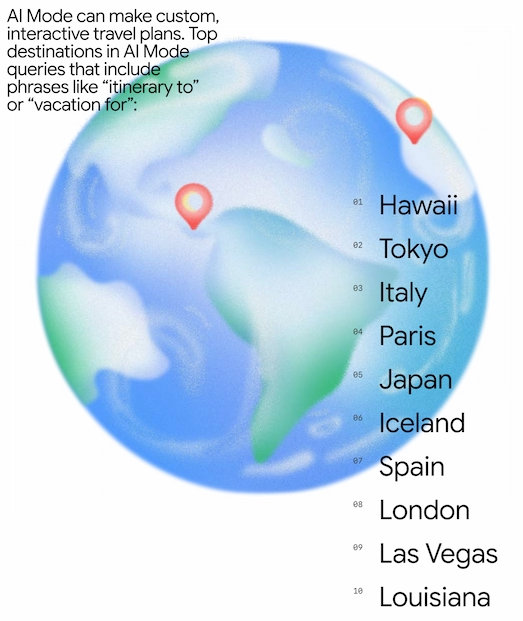
Brainstorming queries are growing 30% faster than AI Mode queries overall. The growth shows up in prompts starting with “where to,” “where should I,” and “ideas for.” Travel is the clearest example. Google’s top destinations in AI Mode itinerary queries are Hawaii, Tokyo, Italy, Paris, Japan, Iceland, Spain, London, Las Vegas, and Louisiana.
These are not users who already know which hotel they want to book. They are at the top of the discovery funnel, often before they have settled on a destination. The same pattern shows up in beginner-skill queries containing phrases like “how to get started” or “beginners guide.” The top activities there are writing, reading, streaming, running, drawing, cooking, guitar, swimming, dancing, and photography.
For most businesses, the practical implication is that AI Mode is shaping a user’s shortlist before the user has typed your brand or your product category. Content that helps with comparison, addresses specific sub-goals (a kid-friendly itinerary, a guitar method for adult beginners, a running plan that avoids cardio), or genuinely contributes local expertise has a real chance of being surfaced. Generic “best of” listicles built only for a head term do not fit the pattern.
Decide: comparison and evaluation
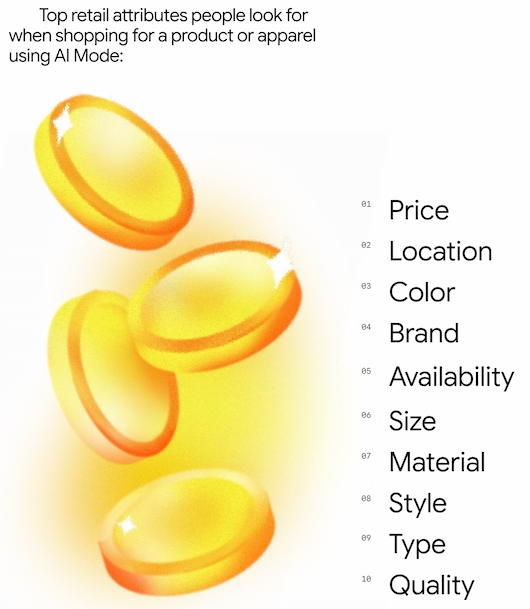
Queries starting with “which” are growing 40% faster than AI Mode queries overall, and the two phrases driving most of that growth are “which of” and “which one.” Google’s data shows electronics and apparel are the top shopping categories where users move follow-up evaluation into AI Mode. The attributes they evaluate against are revealing: price, location, color, brand, availability, size, material, style, type, and quality.
This is where the commercial stakes get sharpest. If a product page hides pricing behind a contact form, lacks variant detail, or fails to surface availability, AI Mode cannot represent that product confidently when a user asks “which one should I buy?” The product is simply left out of the comparison. That is a mechanical exclusion, not a ranking penalty.
The pattern is supported by retailer data outside Google. Adobe Analytics reported that traffic to U.S. retail sites from generative AI sources rose 1,300% year over year during the 2024 holiday season, with Cyber Monday up 1,950%. The 2025 holiday season continued the trend at 693% year-over-year growth, and those AI-referred shoppers converted 31% more than non-AI traffic while bouncing 33% less often. The volume is still modest compared with paid search or email, but the quality of the traffic is meaningfully different.
Learn: study, tutoring, and credentialing
Google’s report shows AI Mode being used heavily as a study and skill-building tool. The top subjects for quiz generation are math, Spanish, history, English, biology, chemistry, vocabulary, algebra, geometry, and nursing. Professional credentials drive a separate cluster: CompTIA Security+, the bar exam, real estate licenses, CPA, CDL, Scrum Master, electrician credentials, and the NCLEX nursing exam.
The interesting pattern here is the depth of follow-up. People are not asking for a single fact. They ask AI Mode to build a quiz, then ask why a wrong answer was wrong, then ask for a related practice problem. This kind of usage favors content structured for instruction rather than reference. Worked examples, glossaries with definitions tied to use cases, progressive depth, and a clear hierarchy of concepts all map well to how this content gets surfaced and re-surfaced in multi-turn sessions.
Authority matters more in this pattern than in most others. In areas like health, finance, and legal information, AI Mode is increasingly the first source a user consults. Content without clear authorship, dating, or source attribution is harder for an AI system to confidently cite, and easier for a user to dismiss when the answer is later questioned.
Create: AI Mode as a workspace
Image creation queries on AI Mode have more than tripled since the start of 2026. The top things people ask AI Mode to create are photos, quizzes, logos, stories or poems, code, messages, lists, and documents. The top things they ask AI Mode to edit are photos, documents, video, messages, code, PDFs, and audio.
For most businesses, this is less a direct opportunity than a signal of how users now think about AI Mode. They open it as a workspace where they make and edit things, alongside the more familiar role of looking things up. Pages that provide templates, prompt starters, downloadable resources, calculators, or worked examples fit that mental model better than pages that only describe a thing.
Do: planning and execution
Planning queries are growing 80% faster than AI Mode queries overall, making this the fastest-growing category in the entire report. The activity covers scheduling, fitness routines, financial budgets, restaurant searches with specific constraints, and complex travel logistics.
Restaurant queries are an unusually clear window into how detailed user intent has become. Google’s top restaurant attributes in follow-up conversations are kid or family friendly, view, bar, vegan or vegetarian, outdoor seating, private or party room, live music, dog friendly, and dancing. Local businesses whose online presence stops at name and address are at a serious disadvantage to ones that maintain detailed, accurate, structured information about hours, menus, accommodations, and amenities.
Google has also built a tool inside AI Mode called Canvas for organizing plans over time. The top Canvas topics are telling: beach and island resort vacation plans, museum and historical tours, national park hiking itineraries, dinner party planning, honeymoons, kid-friendly vacations, bachelorette and bachelor party logistics, and theme park strategies. For fitness, the top Canvas subjects are core and ab routines, lower body splits, marathon training, daily walking goals, sciatica or knee-safe rehab, and stretching. For finance, they are 401k planning, expense tracking, debt snowball plans, and standard monthly household budgets.
That kind of depth is not a fact-lookup pattern. It is a multi-turn, context-carrying, task-completion pattern. The content that gets pulled into these sessions is content that supports specific decisions with specific data.
The data Google did not put in the report
Google’s report is sunny by design. It is a product anniversary post, not an audit. To understand what AI Mode means for actually being found by users, the report has to be read alongside outside research that fills in a more complete picture.
The most cited external study is from Pew Research Center. In an analysis published in mid-2025, Pew looked at nearly 70,000 Google searches from 900 U.S. adults who agreed to share their browsing activity in March 2025. About 18% of those searches produced an AI summary. When an AI summary appeared, users clicked a traditional search result link 8% of the time. When no AI summary appeared, they clicked 15% of the time. Click-through dropped by roughly half. Clicks on the source links inside the AI summaries themselves were even lower, around 1%.
Google publicly disputed the methodology, but multiple independent analyses since have landed in the same neighborhood. A causal study published in early 2026 analyzed 161,382 matched Wikipedia article-language pairs and estimated that AI Overview exposure reduced daily traffic to English Wikipedia articles by approximately 15%, with larger declines for culture topics and smaller ones for STEM. The Wikimedia Foundation itself reported an 8% year-over-year drop in human pageviews in 2025.
Traffic is being redistributed, not erased. Casual top-of-funnel clicks are absorbed by AI answers. Clicks that do happen tend to arrive with stronger intent. That is the actual change.
The Adobe retail data referenced earlier supports the redistribution view. So does Gartner’s 2024 forecast that traditional search engine volume would drop 25% by 2026 as generative AI absorbs queries that previously went to keyword search. The framing in that release is worth quoting directly:
“Generative AI (GenAI) solutions are becoming substitute answer engines, replacing user queries that previously may have been executed in traditional search engines.”
At the same time, Google’s dominance as a referral source has not gone anywhere. SparkToro and Datos data from 2024 found Google driving 63.41% of all U.S. website traffic referrals, which is roughly 10 times more than the next-largest referrer. The 2024 Zero-Click Search Study from SparkToro found that for every 1,000 U.S. Google searches, only 374 ended in a click to the open web. That number has only moved further in the same direction since AI Mode launched.
The picture across sources is consistent. Google is still the dominant gateway. Inside that gateway, casual informational clicks are flowing into AI answers rather than the open web, while commercial and high-intent clicks continue to drive conversions and are arriving with stronger intent than before.
What this actually changes about being findable
Google has been deliberate about telling site owners not to chase AI-specific tricks. The Search Central documentation puts it plainly:
“You don’t need to create new machine readable files, AI text files, or markup to appear in these features. There’s also no special schema.org structured data that you need to add.”
And in the same document:
“There are no additional requirements to appear in AI Overviews or AI Mode, nor other special optimizations necessary.”
A useful read of this is that there are no shortcuts, not that there is no work to do. The work is no longer about adding a magic file or a special tag. It is about whether your content can be understood, represented, and trusted by an AI system that is reading the page the way a person would read it. That is what the discipline of Answer Engine Optimization is actually about.
A few specific implications fall directly out of Google’s data. These are tied to the report’s findings, not generic SEO advice:
- If queries are three times longer and follow-ups are the norm, then a page that answers the obvious next question, the trade-off, and the comparison is more useful to AI Mode than a page targeting a single keyword. The depth of a single page now matters more than the count of pages.
- If the top retail attributes people evaluate are price, location, color, brand, availability, size, material, style, type, and quality, then any product page missing one or more of those attributes is mechanically harder to include in a comparison answer. This is especially true for ecommerce, where Adobe’s data shows electronics and jewelry already convert better from AI traffic than apparel does, in part because the attribute data is cleaner.
- If more than one in six AI Mode queries are non-text, then visual content needs to be structured as searchable evidence. Descriptive alt text, captions that explain context rather than only describing what is in the frame, product photography with multiple angles, and transcripts for video have moved from nice-to-have to baseline.
- If the “Do” pattern is growing 80% faster than AI Mode overall, then local and service businesses need accurate, current, structured information about hours, menus, accommodations, dietary options, and amenities. The detail level matters because the user queries are detailed. “Restaurant near me” is being replaced by “romantic restaurant with intimate seating, candlelight, pescatarian options, this Saturday.”
None of this requires a special schema, a hidden markup, or a workaround. It requires writing, structuring, and supporting content well enough that an AI system can confidently understand it and a user can confidently rely on it. That is the actual job.
What to take away
Google’s report is best read as a behavioral study, packaged as a product anniversary. It documents how a billion people are starting to use search differently, and what kinds of content rise to the top when they do.
The fastest-growing patterns are no longer narrow informational lookups. They are brainstorming, comparing, learning, creating, and planning. Queries are longer, more conversational, more multi-turn, and increasingly multimodal. The categories with the biggest commercial implications, Decide and Do, are also the ones growing fastest.
Outside research fills in the harder part of the story. Casual clicks to the open web are getting absorbed by AI answers, and that pattern is unlikely to reverse. The clicks that do continue to happen are arriving with stronger intent, especially in retail. Google is still the dominant referral source by a wide margin, which means visibility inside Google’s AI layers remains the highest-leverage place to compete for attention.
The practical conclusion: write, structure, and support content well enough that an AI system can read it, summarize it accurately, cite it confidently, and recommend it usefully. That is what visibility looks like in an AI Mode world, and that is the work the next year of search is going to reward.

AI/ML scientist with 20+ years of research & industry experience. Ex-Google DeepMind, MIT, Harvard, Mila. McGill-Mila PhD.

Ex-Microsoft. 10+ years of experience in AI/ML, MSc from Université de Montréal (Mila). US patent holder.
Related articles
- How to Do Prompt Research for AEO and AI Search Optimization
- Why Choose Answer Engine Optimization (AEO) for AI Search Optimization Over Traditional SEO?
- How Answer Engine Optimization Strategies Enhance AI Search Engine Visibility and Brand Discoverability
- What an AI Visibility Audit Actually Covers for SMBs
- What Is llms.txt and How to Implement It for AI Bots (2026 Guide)
Latest articles
- Dental Practice Software in 2026: A Practical Guide to PMS Platforms and AI Tools (US and Canada)
- Google Preferred Sources and AEO: what it is and how it affects your AI visibility
- What You Might Have Missed From Google I/O 2026 (And Why It Matters for AEO and AI Search)
- What We Know About Paid Ads in AI: A Practical, Evidence-Based Guide for 2026
- Google has removed FAQ rich results